KEY FINDINGS

budget table
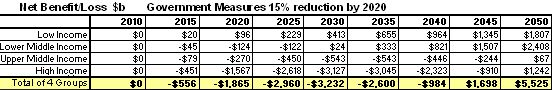
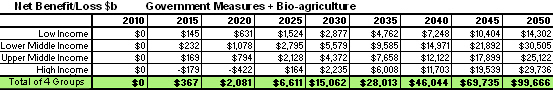
Costs are calculated by GNP/Capita for each country as well as in four income categories as set out by the World Bank, providing equitable methods to distribute costs and benefits among nations.

NEGOTIATION TOOL       PART GRAPHThe calculator can be used as tool for the negotiators involved in creating a world agreement. It enables them to very quickly see the mitigation and financial effects of their proposals; on individual countries as well as on the world as a whole.

graph-Benefits are calculated on the basis of carbon prices set for that particular year.      - Land degradation and land regeneration; food and water shortage and availability are all projected through scientific data taken over the last forty years


How to Use the Tool for World Negotiation


The Tool for World Negotiation consists of five interlinked calculators containing the individual data for every country of the world. Countries are combined into four groups - as classified by the World Bank - Low income, Lower middle income, Upper middle income and High income. The fifth calculator in the Negotiation Tool shows the totals for all four groups If you change data in any of these four groups, the results on the total of all four page changes accordingly. This can allow negotiators to see how changes of emission reduction offers for individual groups will effect the world as a whole - essential information when trying to reach a world agreement.


1. Tables and graphs are the same as for the          Climate  Change Calculator

See how to use the Climate Change Calculator


  2. An Economic Scenario - Special Budget Table

Below are two tables that can be found under the budget tables in the Total of 4 Income Groups sheet. This table is the core of The Tool for World Negotiation.

The first table shows net benefit/losses for government emission reduction measures for each of the four income groups, plus the total of all four. The second table shows net benefit/loss for government measures plus bio-agriculture.


budget table


budget table

The tables show that in 2020 with government measures, the world will have a net loss of $1,865b. The high income countries will take the larger part of this cost (-$1,567b) while the low income countries will see a small benefit ($96b)

If the benefits of bio-agriculture are included, as shown in the second table, the world shows a net benefit of $2,081b in 2020. At this point only the high income countries show a loss (-$422b) and they go into the positive by 2025,($164b)


For more information on interpreting this table see the notes on the budgets page.


When bio-agriculture is introduced into the economic scenario the benefits increase dramatically